- Acid-base indicators are substances that change color depending on the pH of the solution they are in.
- They are typically weak organic acids or bases that exhibit different colors in their protonated and deprotonated forms.
- These indicators are crucial in titrations as they help signal the endpoint of the reaction by undergoing a visible color change.
There are two main theories that explain the behavior of acid-base indicators:
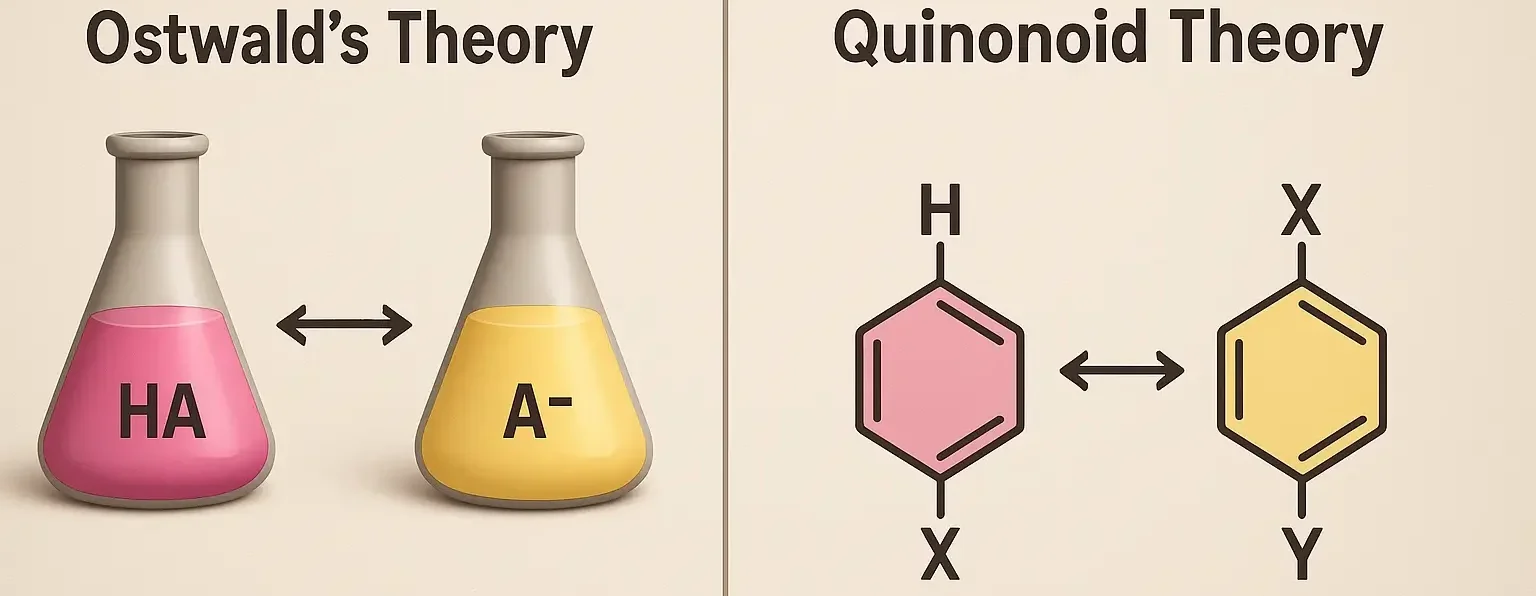
1. Ostwald Theory of acid base indicators (Ionization Theory)
- The Ostwald theory explains the behavior of acid-base indicators based on the ionization equilibrium of weak acids or bases.
- According to this theory:
- Ionization Equilibrium: In the presence of a base, a weak acidic indicator (HIn) can lose a proton (H⁺) to form its conjugate base (In⁻).
- $\mathrm{HIn} \rightleftharpoons \mathrm{H}^+ + \mathrm{In}^-$
- Color Change: Both the protonated form (HIn) and the deprotonated form (In⁻) have different colors due to differences in their electronic structures.
- pH Dependence: The equilibrium shifts based on the pH of the solution, causing a color change as the concentration of H⁺ ions changes.
Demo Ad
This is a sample ad placement!
This is a sample ad placement!
Examples
Phenolphthalein
- Ionization Equilibrium:
- $\mathrm{HIn\ (colorless)} \rightleftharpoons \mathrm{H}^+ + \mathrm{In}^-\,\mathrm{(pink)}$
- Behavior:
- In acidic solutions, the equilibrium favors the colorless protonated form (HIn).
- In basic solutions, the equilibrium shifts towards the pink deprotonated form (In⁻).
Methyl Orange
- Ionization Equilibrium:
- $\mathrm{HIn\ (red)} \rightleftharpoons \mathrm{H}^+ + \mathrm{In}^-\,\mathrm{(yellow)}$
- Behavior:
- In acidic solutions, the equilibrium favors the red protonated form (HIn).
- In basic solutions, the equilibrium shifts towards the yellow deprotonated form (In⁻).
Demo Ad
This is a sample ad placement!
This is a sample ad placement!
2. Quinonoid Theory of acid base indicators (Resonance or Quasi-Valence Theory)
- The quinonoid theory explains the color change of indicators based on the resonance structures and electron distribution within the molecules.
- According to this theory:
- Resonance Structures: Indicators can exist in two tautomeric forms—benzenoid and quinonoid structures—which have different colors.
- Electron Distribution: Gaining or losing a proton changes the electron distribution, altering the absorption of light in the visible spectrum and thus the color.
- Color Dependence: The color of the indicator is determined by the predominant resonance structure at a given pH.
Examples
Phenolphthalein
- Structural Change:
- In acidic solutions, phenolphthalein exists in its colorless lactone (benzenoid) form.
- In basic solutions, it loses a proton to form a pink-colored quinonoid structure.
- Color Change Mechanism: The shift from the lactone form to the quinonoid form changes the electron delocalization, resulting in a color change.
Demo Ad
This is a sample ad placement!
This is a sample ad placement!
Methyl Orange
- Structural Change:
- In acidic conditions, methyl orange exists in a red-colored benzenoid form.
- In alkaline conditions, it shifts to a yellow-colored quinonoid form.
- Color Change Mechanism: The change in resonance structures alters the wavelengths of light absorbed, leading to a visible color change.
Thank you for reading from Firsthope's notes, don't forget to check YouTube videos!