- Dose-Response Relationship describes how the magnitude of a drug’s effect changes with different doses, showing potency and efficacy.
- The dose-response relationship explains how a drug’s effect changes with varying doses—central to pharmacodynamics.
-
Graded Dose-Response
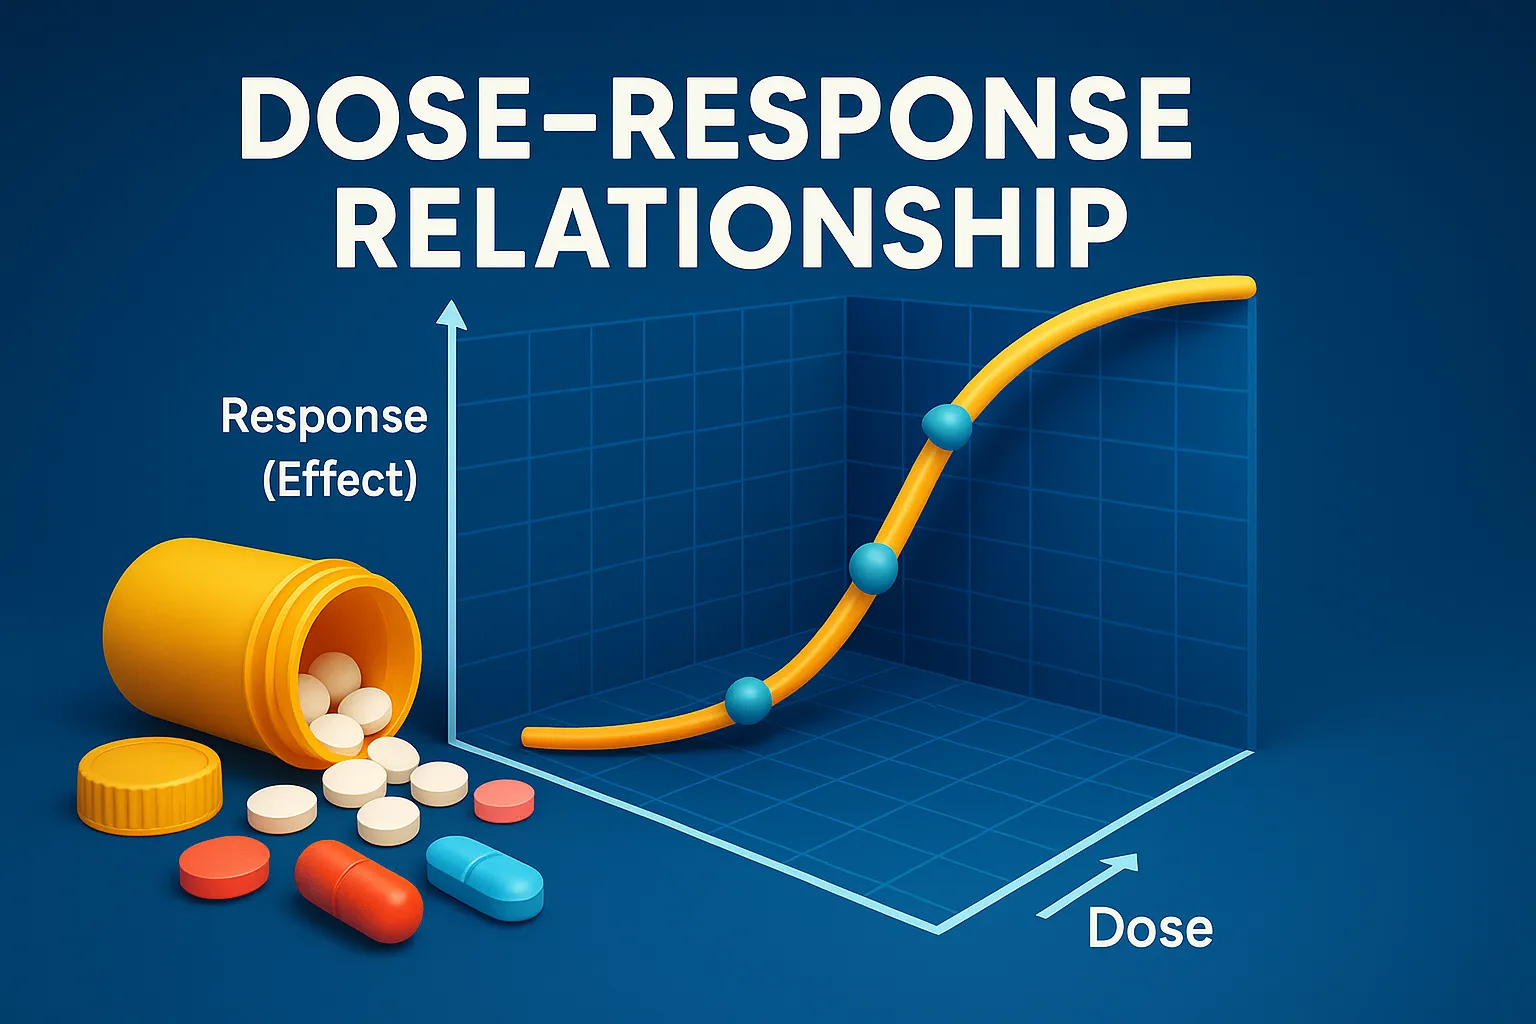
- Measures the intensity of response in an individual as dose increases.
- Displayed as a sigmoidal (S-shaped) curve on a semi-log graph.
-
Phases of the Curve:
- Threshold – Minimum dose with a measurable effect.
- Linear (log) phase – Effect increases proportionally with dose.
- Plateau – Maximum effect (Emax); further dosing has no added effect.
Advertisements -
Key Terms:
- Emax: Maximum achievable effect.
- EC50: Dose producing 50
- Potency: Lower dose needed for effect = more potent.
- Efficacy: Maximum effect a drug can achieve.
Advertisements -
Quantal Dose-Response
- Measures all-or-none effects (e.g., sleep, death) across a population.
- Curve shows
-
Key Terms:
- ED50: Dose causing desired effect in 50
- TD50: Dose causing toxicity in 50
- LD50: Dose causing death in 50
-
Therapeutic Index (TI):
- TI = TD50 / ED50
- Indicates drug safety—higher TI = safer drug.
Advertisements
Click Here to Watch the Best Pharma Videos
Advertisements