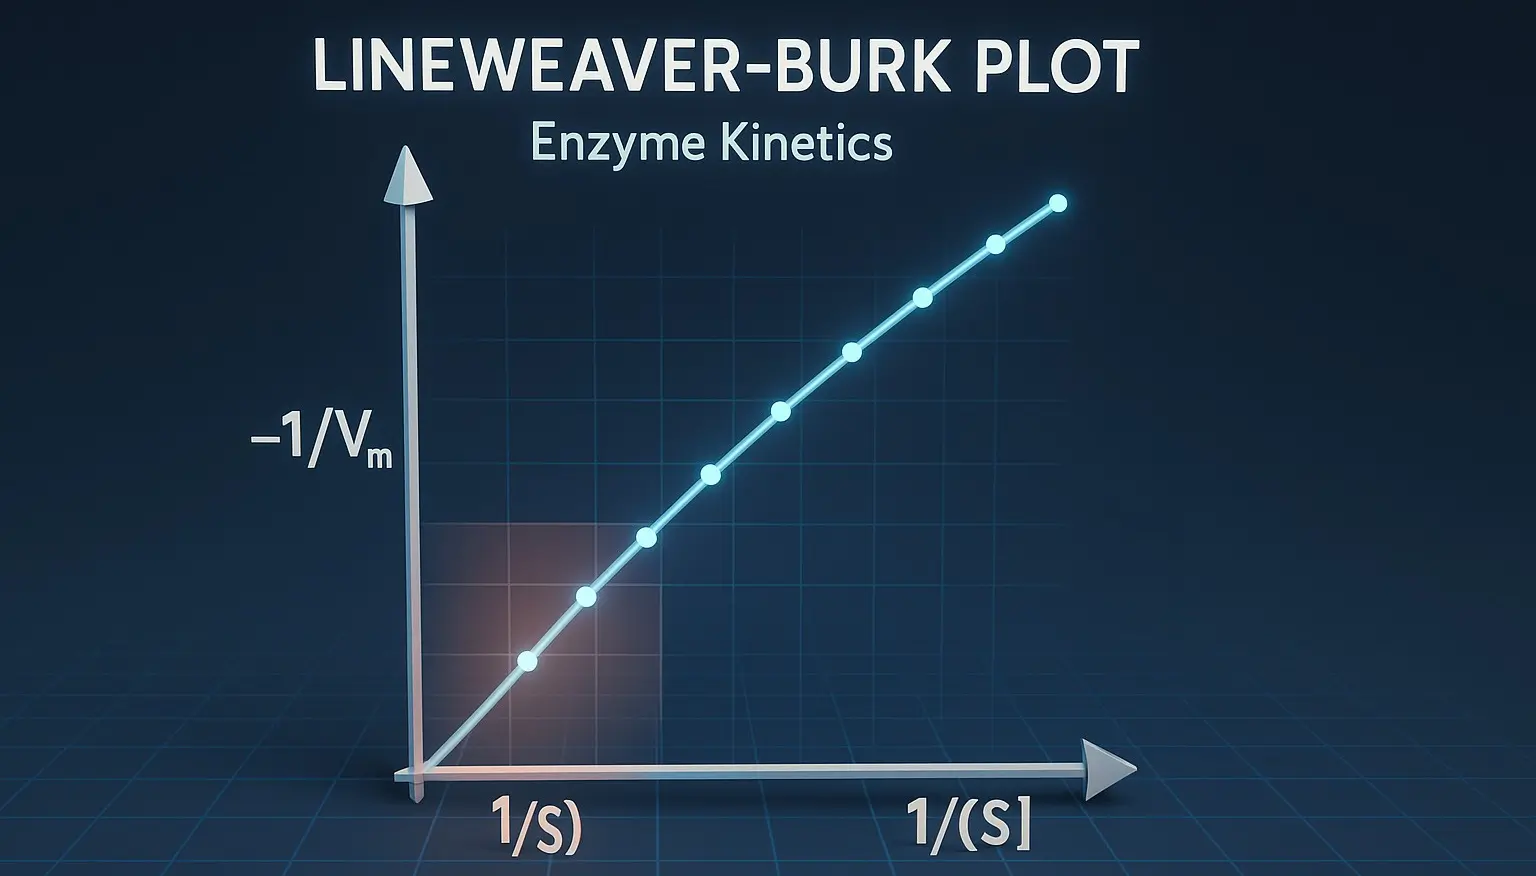
- The Lineweaver-Burk plot, also known as the double-reciprocal plot, is a graphical representation used to determine important kinetic parameters of an enzyme-catalyzed reaction, specifically the Michaelis constant (𝐾𝑚) and the maximum reaction velocity (𝑉max).
Lineweaver-Burk Equation
$\frac{1}{v} = \frac{K_m}{V_{\text{max}} [S]} + \frac{1}{V_{\text{max}}}$
Description:
- The Lineweaver-Burk plot, or the double reciprocal plot, graphs 1/v (reciprocal of the reaction rate) against 1/[S] (reciprocal of the substrate concentration).
- This transformation facilitates a linear relationship that simplifies the determination of Vmax and Km.
- In this plot:
- The y-intercept equals 1/Vmax.
- The x-intercept is −1/−Km.
- The slope represents Vmax/Km.
Advantages and Uses:
- The linear nature of allows for a straightforward extraction of kinetic parameters. Additionally, this plot is particularly valuable in enzyme inhibition studies.
- By comparing changes in the plot’s slope, y-intercept, and x-intercept, one can deduce the type of inhibition (competitive, non-competitive, or uncompetitive) affecting the enzyme.
Click Here to Watch the Best Pharma Videos
Advertisements